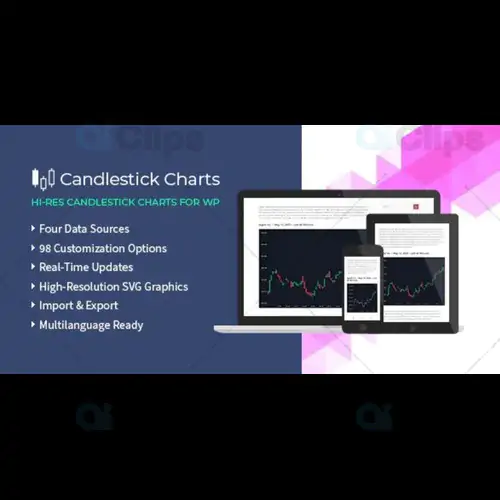
In the world of financial markets, data visualization plays a pivotal role in making informed decisions. One of the most widely used methods for visualizing market data is through Candlestick Charts. These charts provide a clear, concise, and powerful way to analyze price movements, identify trends, and predict future market behavior.
Whether you're involved in stock trading, forex, or cryptocurrency markets, Candlestick Charts offer a rich set of visual cues to understand price action better than many other charting methods.
In this article, we will dive into the basics of Candlestick Charts, explore their components, and show you how to use them effectively for both trading and data analysis. Additionally, we will explain how you can integrate these charts into your website or platform for improved user experience and analytical capabilities.
Understanding Candlestick Charts: The Basics
Candlestick Charts are a type of financial chart used to represent price movements over a specified time period. Each "candlestick" consists of four key price points:
Each candlestick is made up of a "body" and "wicks" (also known as "shadows"). The body represents the range between the open and close prices, while the wicks represent the range between the high and low prices.
By combining several Candlestick Charts, traders can identify patterns that provide insights into market sentiment, trend reversals, or continuation signals.
Why Use Candlestick Charts?
There are several reasons why Candlestick Charts are preferred by traders, analysts, and data professionals alike. Here are the key benefits:
1. Visual Clarity
Candlestick Charts provide a clear and easy-to-understand visual representation of market data. The color-coded candlesticks immediately give you an idea of whether the market is in a bullish or bearish trend, without needing to interpret a series of complex numbers.
2. Identification of Trends and Reversals
Candlestick patterns, such as the Doji, Hammer, Engulfing, and Morning Star, provide critical insights into potential trend reversals or continuations. For example, a Doji candlestick signals market indecision, while an Engulfing pattern may indicate a trend reversal. Traders often use these signals to make buy or sell decisions.
3. Time Efficiency
Because Candlestick Charts provide a compressed view of price data, they allow traders and analysts to quickly assess market conditions. Unlike traditional line charts, candlestick charts give a more comprehensive view of price action, including volatility, range, and overall trend direction.
4. Support for Multiple Timeframes
Candlestick Charts can be used across various timeframes. Whether you're analyzing minute-by-minute changes in the stock market or tracking long-term price movements on a weekly or monthly scale, Candlestick Charts provide flexibility for different levels of analysis. Traders often use multiple timeframes to confirm patterns or trends across different scales.
How to Read Candlestick Charts
Learning how to interpret Candlestick Charts effectively is crucial for anyone involved in trading or data analysis. Here are the basic elements to understand when reading a candlestick chart:
1. Candlestick Body
The body of the candlestick shows the range between the open and close prices during the selected time period. A long body indicates strong momentum, while a short body suggests consolidation or indecision.
2. Wicks (Shadows)
The lines above and below the body of the candlestick represent the high and low price for the time period. The top wick shows the highest price, while the bottom wick shows the lowest price. Long wicks often indicate high volatility during the time period, while short wicks may suggest stable price movement.
3. Patterns to Watch For
Over time, certain candlestick patterns have emerged as reliable indicators of market trends. These patterns are combinations of one or more candlesticks that suggest market sentiment or behavior. Common patterns include:
4. Candlestick Chart Timeframes
A single candlestick represents a specific time period, such as 1 minute, 5 minutes, 1 hour, 1 day, or even 1 week. The timeframe you choose to view will depend on the level of detail you need for your analysis. For short-term traders, shorter timeframes (1-minute to 15-minute charts) are often used, while long-term investors prefer daily, weekly, or monthly charts.
Using Candlestick Charts for Data Analysis and Trading
While Candlestick Charts are a popular tool for traders, they are also highly beneficial for business data analysis. For example, eCommerce businesses can use Candlestick Charts to track and analyze product sales, identify customer buying behavior trends, and forecast demand.
For traders, Candlestick Charts are often used in conjunction with other technical analysis tools, such as moving averages, RSI, and MACD, to enhance trading strategies. By combining multiple technical indicators, traders can make more accurate predictions about price movements and avoid false signals.
Implementing Candlestick Charts on Your Website
If you run a trading platform, financial blog, or analytics site, adding Candlestick Charts to your website can greatly enhance the user experience. By integrating Candlestick Charts into your site, you can provide your users with interactive charts, live updates, and detailed market analysis.
You can integrate Candlestick Charts using plugins or charting libraries like TradingView or Chart.js. These tools allow for real-time updates, zoom-in and zoom-out functionalities, and detailed chart annotations, which will engage your audience and improve the overall user experience.
At GPLSelect, we offer a variety of charting plugins and tools that can help you integrate advanced charting capabilities into your website.
Conclusion: Why Candlestick Charts are Essential for Trading and Data Analysis
Whether you're a seasoned trader or a business looking to analyze sales data, Candlestick Charts are an indispensable tool. Their ability to visually represent price movements and trends in a simple yet effective manner makes them a must-have for anyone in the trading world.
By mastering Candlestick Charts, you can make more informed decisions, whether it's for short-term trading or long-term investment strategies. And if you're building a website that offers financial data, integrating Candlestick Charts will provide added value to your users.
Subscribe to access Multiple downloads of themes, plugins, CMS Templates, HTML Templates, and more premium assets for your creative needs.
Published:
Nov 11, 2024 03:40 PM
Version:
v1.09
Category: